1.1
Phases
See where the innings actually goes — powerplay, middle, death — for your side and theirs.
Somebody at your club writes down every delivery of every match, and then the book goes in a bag. Shadow Stats reads those scorecards back and gives you the analysis a professional set-up would have.
Every ball your club has recorded, read back in a week — not a winter.
One price for the whole club, every squad · from R714 a month · see pricing
No balls entered yet. Use the buttons below to tap out an over.
Every club in every league writes down the same four things. Almost none of them get the four that would actually change a team talk.
Not doing this isn’t free. Somebody at your club is already doing a worse version of it by hand, on a Tuesday, after work.
Two scorers, a WhatsApp group and a league site that updates on Tuesday.
Again. Every week. And the totals still have to be checked against the card.
Sorting columns by hand, because a spreadsheet has no idea what a phase is.
Mostly from memory, mostly about the two players everybody already has an opinion on.
Reading back their last few cards to work out who bats where and who bowls when.
Over three hours a week. Across an October-to-April season that is roughly 85 hours — two full working weeks, by hand, and the answer at the end of it is still a guess.
Forward the file your scorer already produces. Nobody learns anything new.
Phases, form, match-ups, workload and Best XI are already worked out.
Forwarding the scorer’s file is the only thing anyone at the club has to do differently.
And the part that isn’t hours
The times above are our estimate of the manual job, not a measured result from a customer. Your Tuesday may be worse.
Each one answers a question a coach actually asks out loud in the week before a match.
See where the innings actually goes — powerplay, middle, death — for your side and theirs.
Set a target per player and watch it move match to match, instead of guessing at season end.
Who is coming into form and who is quietly falling out of it, before selection night.
How a batter has fared against a specific bowler or bowlers, counted ball by ball.
A side picked on the record, with the reason attached to every pick.
What the opposition does well and where they leak, before you play them.
Overs per bowler per match, so nobody gets quietly overbowled into an injury.
Which pairs build and which ones break, and at what score it happens.
How each batter actually gets out, and which phase keeps costing you wickets.
Fifty overs of bowling, every match of a season, one bar each. No scorebook ever adds this up, because a scorebook is written one over at a time.
Bowling economy for each of the fifty overs across the demo season. The first forty overs average 3.34 to 3.39 an over. Overs 41 to 50 average 5.20.
Forty overs of respectable bowling, then the last ten go at five an over. Nobody at the club is hiding this — it is in every scorecard they filled in, one over at a time, and no scorebook adds it up.
Open this seasonThe same shape turns up in clubs on the platform — alongside two things a spreadsheet has no way of asking.
Tight up front, tight through the middle, then overs 40 to 50 cost them five an over. The difference between defending 230 and losing with four to spare.
One opposition bowler against one top order, counted across a season. They had faced him before and never once come with a plan for him.
Not five injuries waiting to happen — two matches in seven days. The fixture list was the problem, and it was visible before the second game.
The chart is the demo season, generated for the purpose — it is the same season you open at the live demo. The three findings under it are real, from clubs on the platform, with club and player names removed.
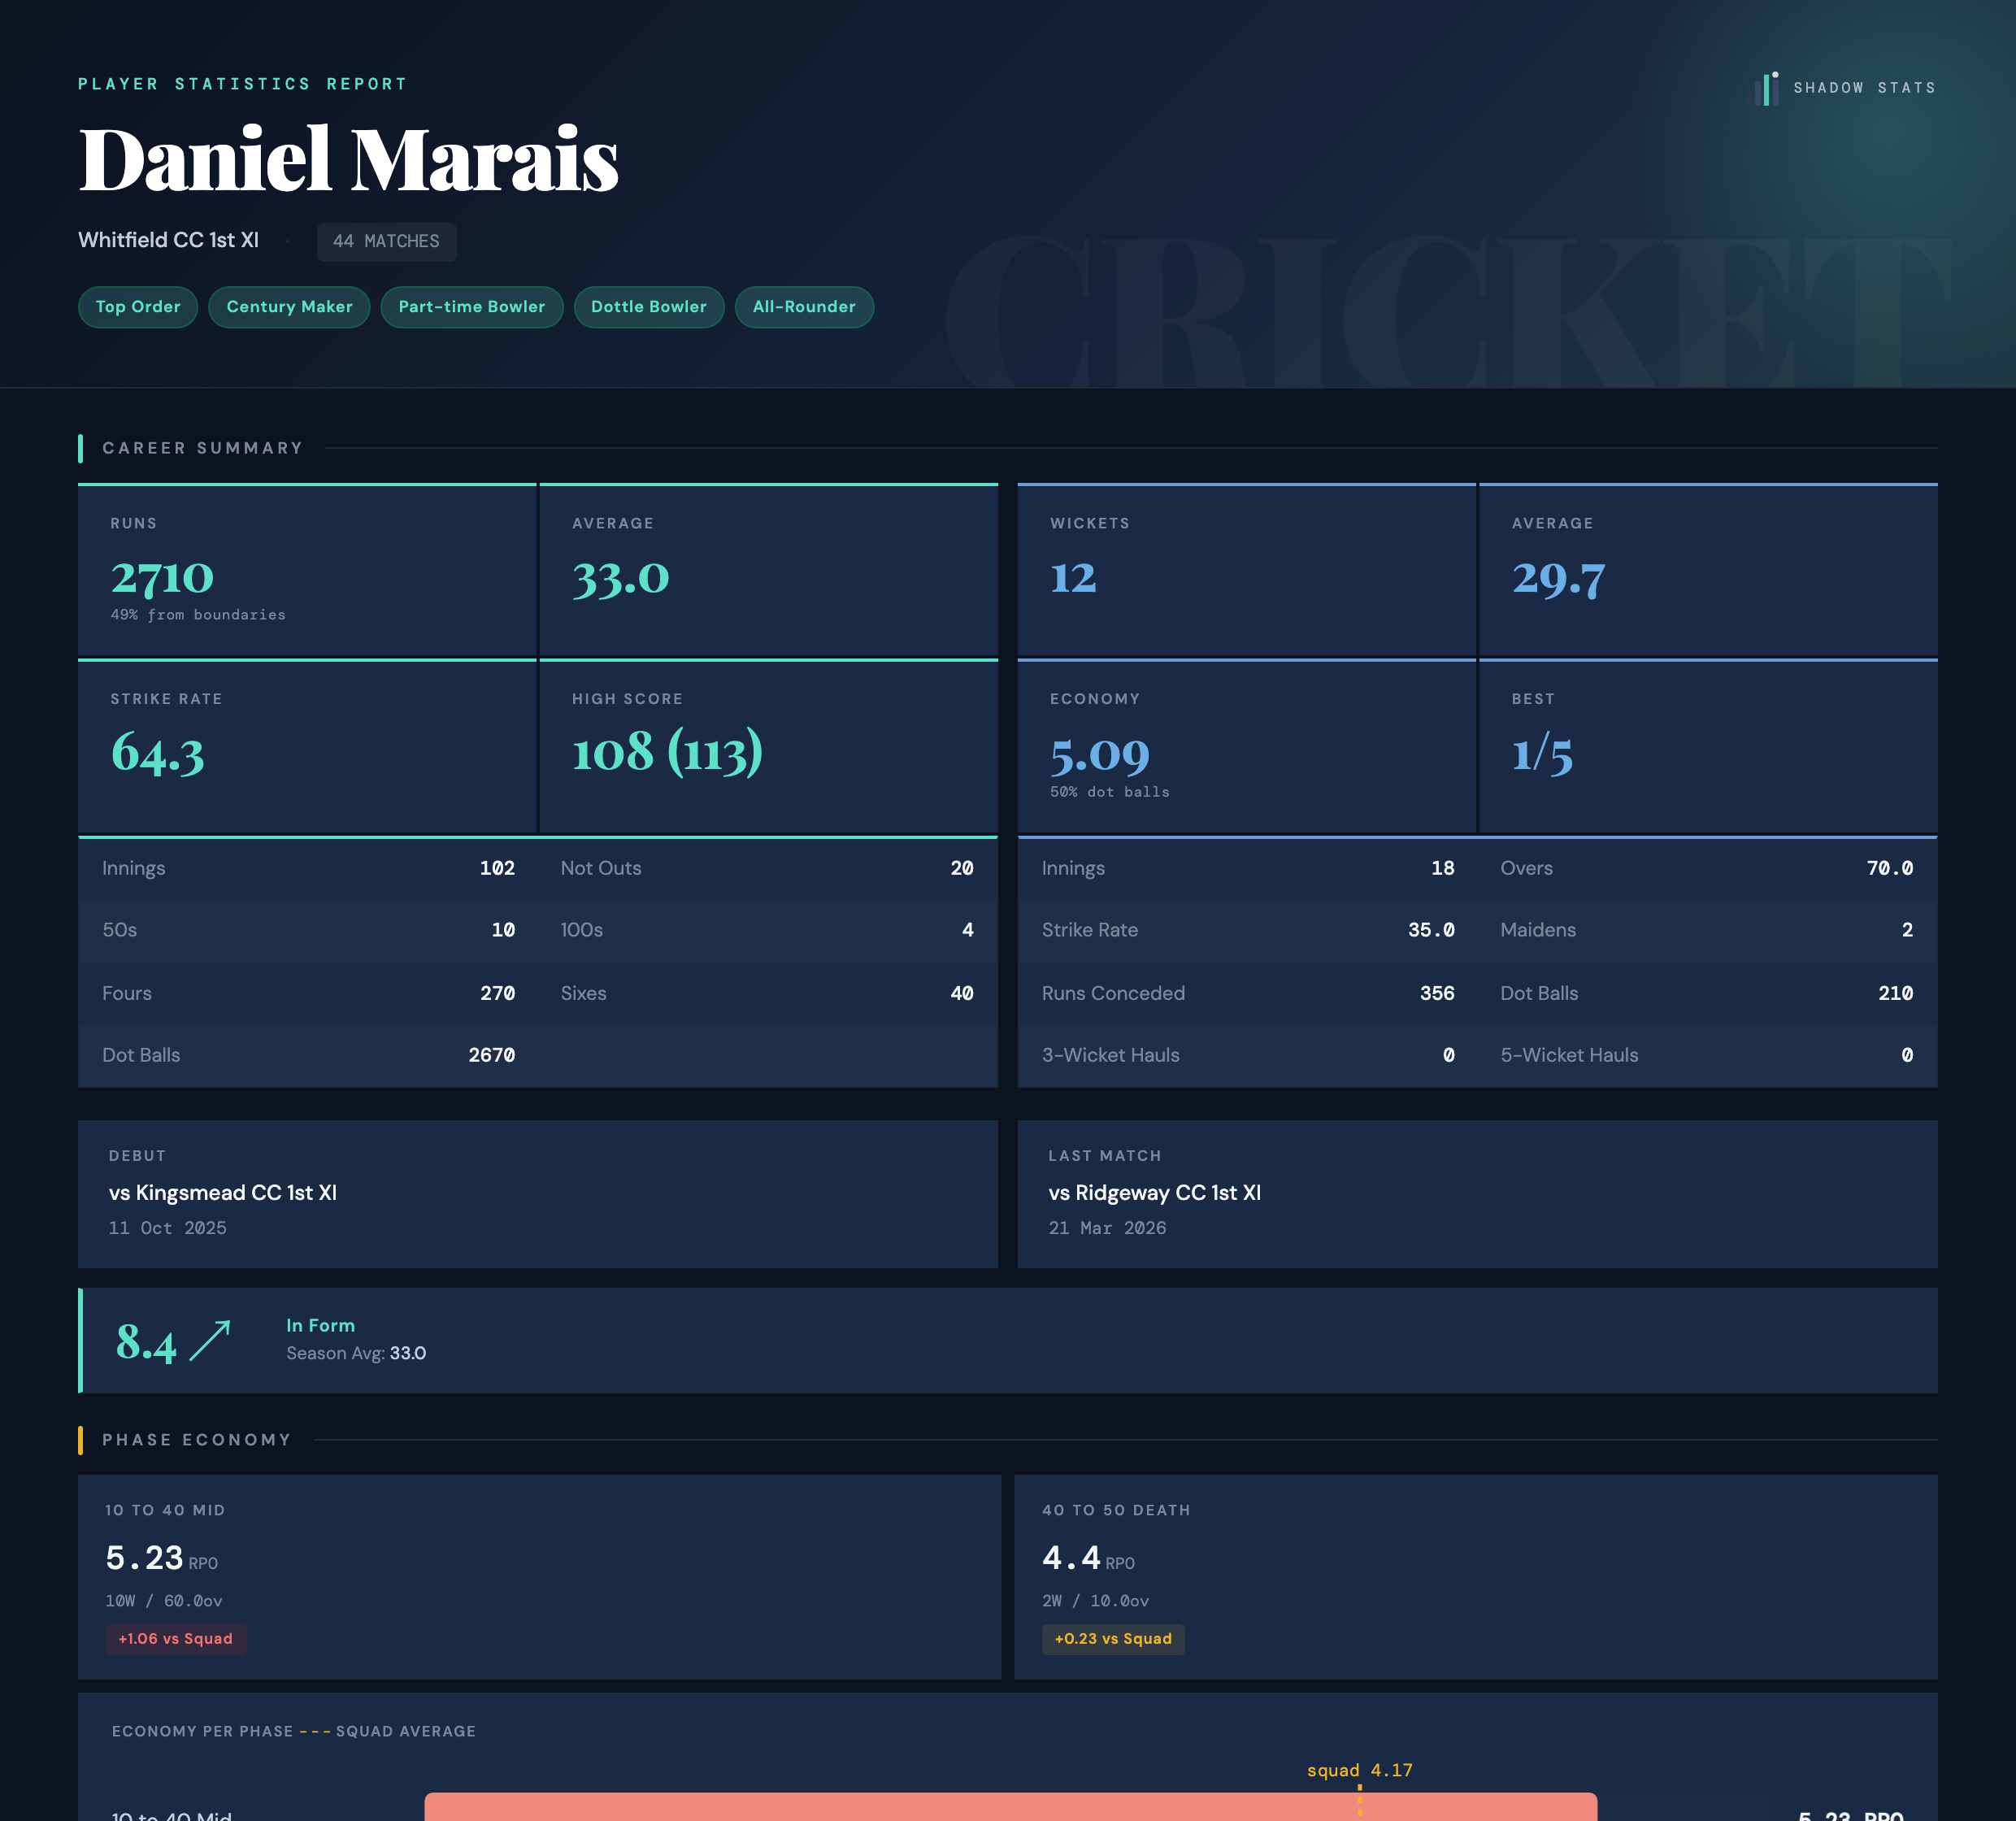
A full career report as a PDF — hand it to the player, take it into a selection meeting, or send it to a parent. It is the same numbers the dashboard shows, on paper.
Upload the file your scorer already produces. No new app for anyone to learn on match day.
Each delivery is parsed and stored — runs, extras, dismissals, who bowled it and when.
Phases, KPIs, form, match-ups and Best XI are waiting, and every player has a report you can print.
Not per team, not per coach, not per player. Two ways to pay for the season — the only real decision is whether you pay up front.
+ R1,000 once-off setup — R1,999 due on your first invoice
Cancel at the end of any month.
+ R1,000 once-off setup — R5,999 due on your first invoice
October to April, 7 months — about R714 a month. League cricket ends in the last week of March, so 1 April closes the season.
Your team, your logins, and up to one past season of your own matches loaded and reconciled. Charged once, at the start, never again.
Everything stays live and readable, reports included. Uploads pause until October, and there is no setup fee to come back.
Prices in rands, VAT included. Running a league or a union rather than a club? Talk to us — that is one agreement, not twenty.
The R1,000 covers the work of getting your club's actual history into the system, which is a job we do rather than a form you fill in:
It usually takes a few days from the point we have your scorecards. It is charged once, at the start, and never again — a renewal costs nothing to set up.
You are not paying to look at sample data. The first dashboard you open is your own season.
The scorecards are your club's and so is everything we derive from them. You can export your leaderboards and download a full report for every player at any time, without asking us.
If you stop, nothing is deleted on the way out. Ask for an export and you get your matches and your reports.
The off-season vault exists so that pausing does not mean starting again: your history stays loaded and readable, and October picks up where April left off.
We work from the structured match files your scoring platform exports — the ones that contain every delivery, not just the summary totals.
If your league publishes scorecards somewhere we have not read before, send us one example. Adding a new source is normal work for us, not an obstacle.
A summary-only card (totals but no ball-by-ball) can still be loaded, but the views that count deliveries — phases, match-ups, partnerships, the Manhattan — will be empty for that match.
Only people your club invites. Every account belongs to exactly one team, and the analysis you see is scoped to that team — one club cannot see another club's matches, players or reports.
Opposition numbers you see in Scout and Match-ups come from matches your own club played, not from another club's account.
That is a normal way to buy it. Pay for the season, use it from October to April, and decide in the winter.
If you do not carry on, take your exports with you. If you keep the vault at R249 a month, your history and every player report stay live, and there is no setup fee the second time.
Everything else is on the FAQ, and a person answers the rest.
Tell us your club and how you keep scorecards now. We will come back with what we can read, what it will cost you, and how long the load will take.